⛳ Hobart, Tasmania is situated in or near the cool temperate moist forest biome.
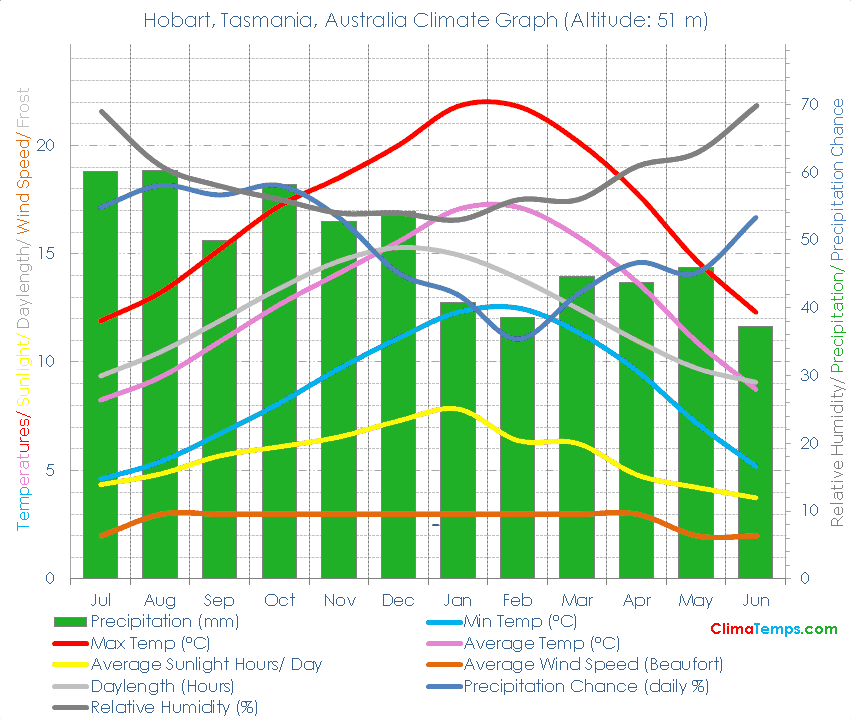
🌡️ The annual average temperature is 12.9 degrees Celsius (55.1 degrees Fahrenheit). See the temperatures page for a monthly breakdown and the fixed scale graph.
🐬 Average monthly temperatures vary by 8.9 °C (16°F). This indicates that the continentality type is hyperoceanic, subtype barely hyperoceanic.
☔ Total annual precipitation averages 586.5 mm (23.1 inches) which is equivalent to 586.5 Litres/m² (14.39 Gallons/ft²).
Simply paste the following HTML code into your webpage. Please include a link back to this website. There is one in the following code already. Edit the width attribute to change the size of the graph if needed:
In the winter time records indicate temperatures by day reach 12.5°C (54.4°F) on average falling to 5.1°C (41.1°F) overnight.
In spring time temperatures climb reaching 17°C (62.5°F) generally in the afternoon with overnight lows of 8.2°C (46.7°F).
During summer average high temperatures are 21.2°C (70.2°F) and average low temperatures are 12°C (53.5°F).
Come autumn/ fall temperatures decrease achieving average highs of 17.6°C (63.6°F) during the day and lows of 9.4°C (48.9°F) generally shortly after sunrise.
✨ The longest day of the year is 15:10 long on the 21 of December and the shortest day is 8:50 long on the 22 of June.
🌞 On average there are 2110 hours of sunshine per year. Visit the sunshine and daylight section to check monthly details including how high in the sky the sun reaches each month.
🐇Were you to burrow down through the centre of the Earth from Hobart, Tasmania you would pop up nearest to the climate station at Santa Cruz, Flores, Azores where you would find a Humid subtropical climate.
🌍Hobart, Tasmania, Australia is at 42°53'S, 147°19'E, 51 m (169 ft). Check the location on the map.
| Climate Variable | Jul | Aug | Sep | Oct | Nov | Dec | Jan | Feb | Mar | Apr | May | Jun | Annual | ||
|---|---|---|---|---|---|---|---|---|---|---|---|---|---|---|---|
| Average Max Temperature °C ( °F) | 12 (53) | 13 (56) | 15 (59) | 17 (63) | 19 (65) | 20 (68) | 22 (71) | 22 (71) | 20 (68) | 18 (64) | 15 (58) | 12 (54) | 17 (63) | ||
| Average Temperature °C ( °F) | 8 (47) | 9 (49) | 11 (52) | 13 (55) | 14 (57) | 16 (60) | 17 (63) | 17 (63) | 16 (60) | 14 (57) | 11 (52) | 9 (48) | 13 (55) | ||
| Average Min Temperature °C ( °F) | 5 (40) | 5 (42) | 7 (44) | 8 (47) | 10 (49) | 11 (52) | 12 (54) | 13 (55) | 11 (53) | 10 (49) | 7 (45) | 5 (41) | 9 (48) | ||
| Average Precipitation mm (in) | 60 (2) | 60 (2) | 50 (2) | 58 (2) | 53 (2) | 54 (2) | 41 (2) | 39 (2) | 45 (2) | 44 (2) | 46 (2) | 37 (1) | 587 (23) | ||
| Number of Wet Days (probability of rain on a day %) | 17 (55) | 18 (58) | 17 (57) | 18 (58) | 16 (53) | 14 (45) | 13 (42) | 10 (35) | 13 (42) | 14 (47) | 14 (45) | 16 (53) | 180 (49) | ||
| Average Sunlight Hours/ Day | 4h 21' | 4h 50' | 5h 52' | 6h 05' | 6h 46' | 7h 17' | 7h 50' | 7h 00' | 6h 15' | 4h 58' | 4h 13' | 3h 52' | 5h 46' | ||
| Average Daylight Hours/ Day | 9h 21' | 10h 27' | 11h 54' | 13h 23' | 14h 39' | 15h 16' | 14h 56' | 13h 53' | 12h 29' | 10h 59' | 9h 43' | 9h 04' | 12h 00' | ||
| Percentage of Sunny (Cloudy) Daylight Hours | 47 (53) | 47 (53) | 50 (50) | 46 (54) | 47 (53) | 48 (52) | 53 (47) | 51 (49) | 51 (49) | 46 (54) | 44 (56) | 43 (57) | 48 (52) | ||
| Sun altitude at solar noon on the 21st day (°). | 26.6 | 35 | 46.3 | 57.6 | 66.8 | 70.5 | 66.9 | 57.6 | 46.9 | 35.3 | 27 | 23.7 | 46.7 |
Please take a moment to share a climate graph or simply the address:
Thank You, so much! ❤️